Last updated : Jan 19, 2023.
Overview
You can gain insight and analyze the progress and quality of your project by connecting Power BI to the data collected and stored for Team Services.
Power BI is a suite of business analytics tools that deliver insights throughout your organization. Connect to hundreds of data sources, simplify data prep, and drive ad hoc analysis. Produce beautiful reports, then publish them for your organization to consume on the web and across mobile devices. Everyone can create personalized dashboards with a unique, 360-degree view of their business. And scale across the enterprise, with governance and security built-in.
The Analytics Marketplace extension and upcoming updates to the Power BI Desktop connector for VSTS are intended to replace and improve on the capabilities of the Content Pack. While the Analytics Marketplace extension currently supports Work Item Tracking data, we will update it to support additional data types including Tests, Build, Release and Version Control. In the interim, you can use VSTS REST APIs as an alternative to the Content Pack to report on these additional data types.
Prerequisites
-
You should have Office365 account in order to integrate Visual Studio Team Services with Power BI
-
Visual Studio Team Services account. If you don’t have one, you can create from here
Authorize Power BI to access your account data
Your first step requires you to authorize Power BI to access your Team Services account. Choose between one of these two connection scenarios when connecting to Power BI:
Scenario #1: You use the same Azure Active Directory (AAD) account to log in to Team Services and Power BI.
Scenario #2: You use an MSA (Microsoft account/LiveID) to log in to Team Services or you use different AAD credentials to log into Team Services than you use to log into Power BI.
Log in to Power BI
-
Go to Power BI site
-
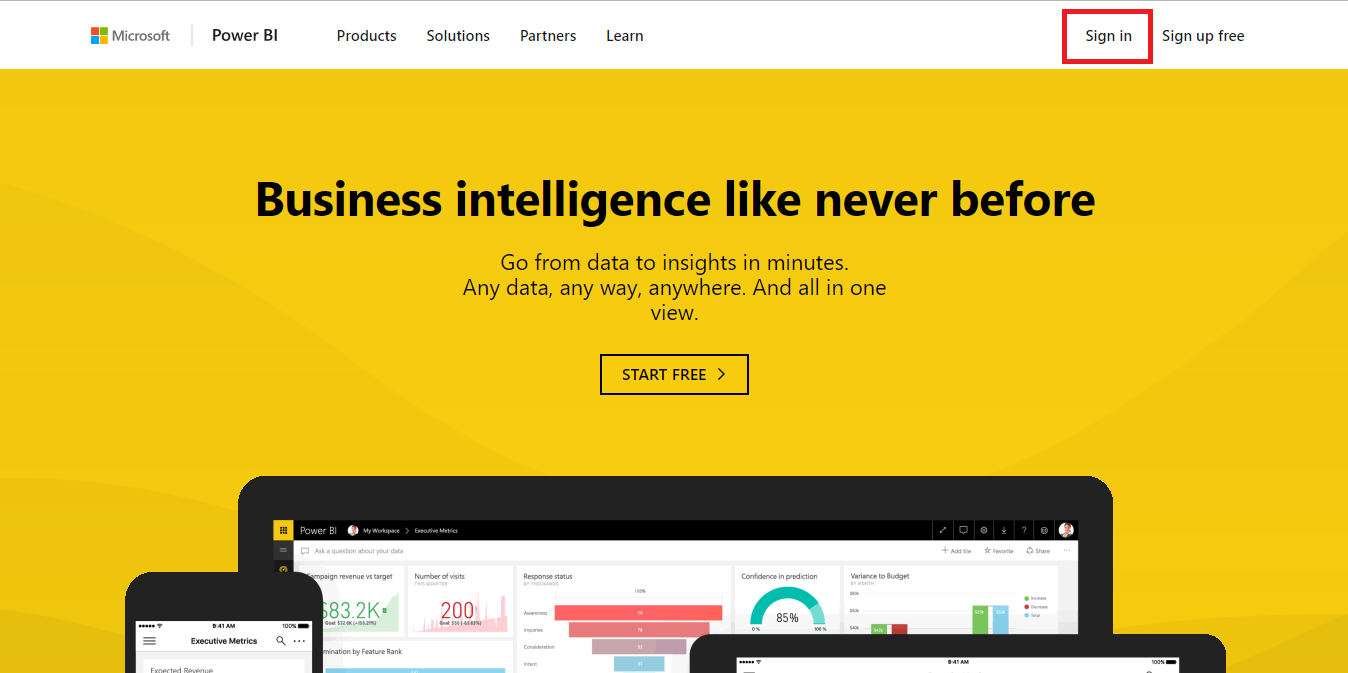
Click Sign In in the upper right corner to log in to Power BI.
-
You can use either AAD or MSA account to log in.
Note: If you don’t have a Power BI account you can create one by entering your email address and click Use it free.
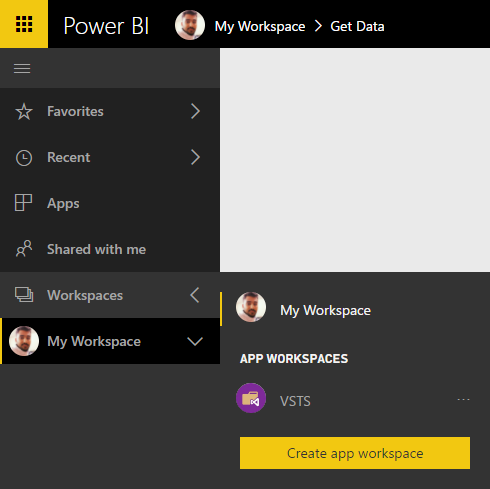
Managing Workspaces
Workspaces in Power BI allows you to have isolated area to monitor your teams work. You can add, remove, edit and grant permissions either to edit or read the contents present in the workspace.
-
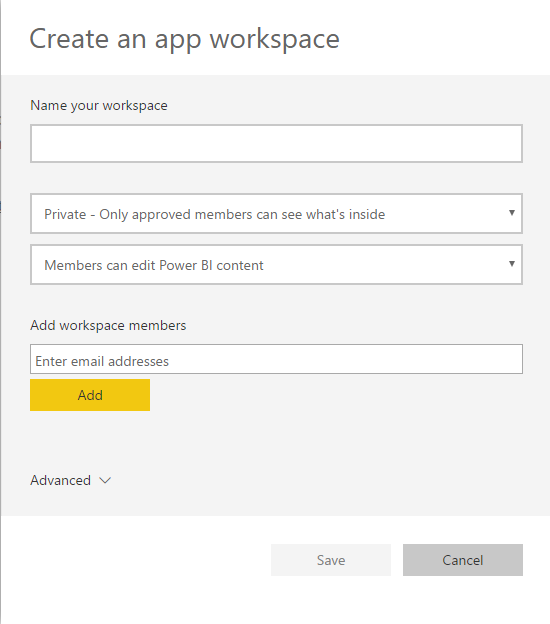
Go to Workspaces and click on Create app workspace.
-
Give a name for the workspace and set the desired permissions. For this lab let’s keep it default and create one.
-
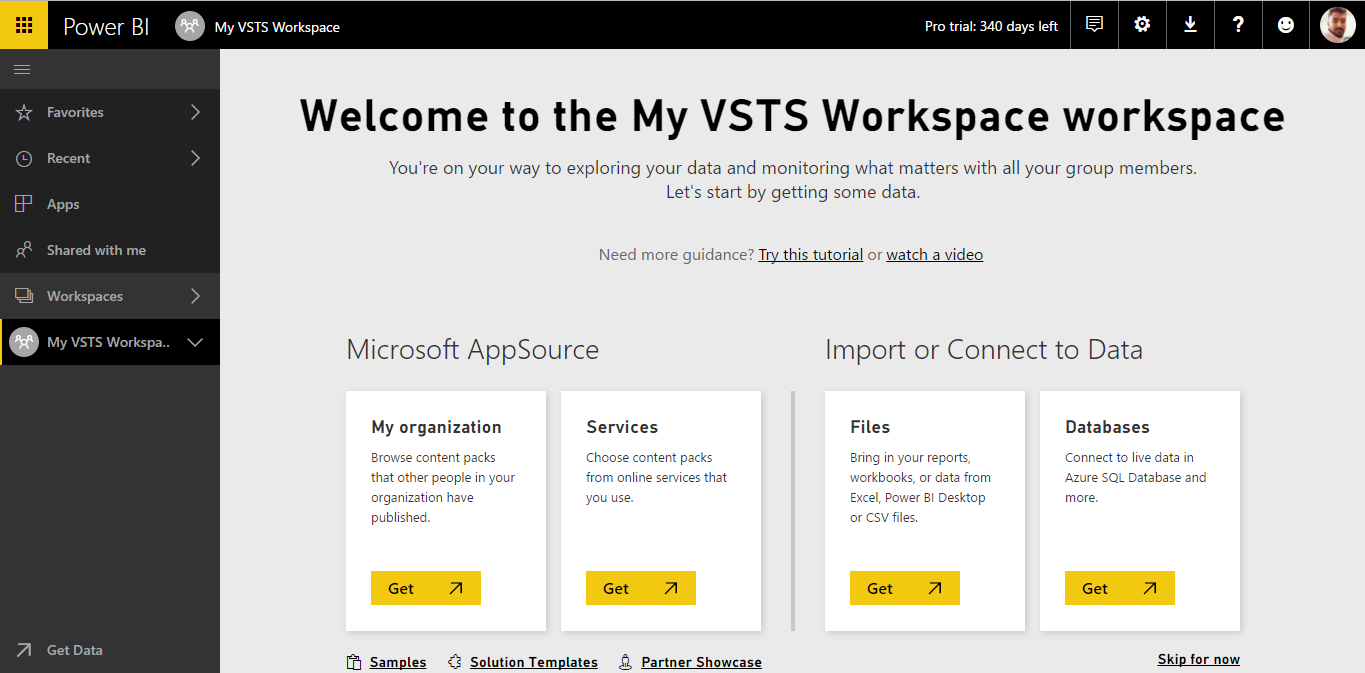
A new workspace is created now.
Connect to services with content packs for Power BI
You can connect to content packs for a number of services you use to run your business, such as Salesforce, Microsoft Dynamics, Visual Studio Team Services and Google Analytics. Power BI starts by using your credentials to connect to the service, and then creates a Power BI dashboard and a set of Power BI reports that automatically show your data and provide visual insights about your business.
-
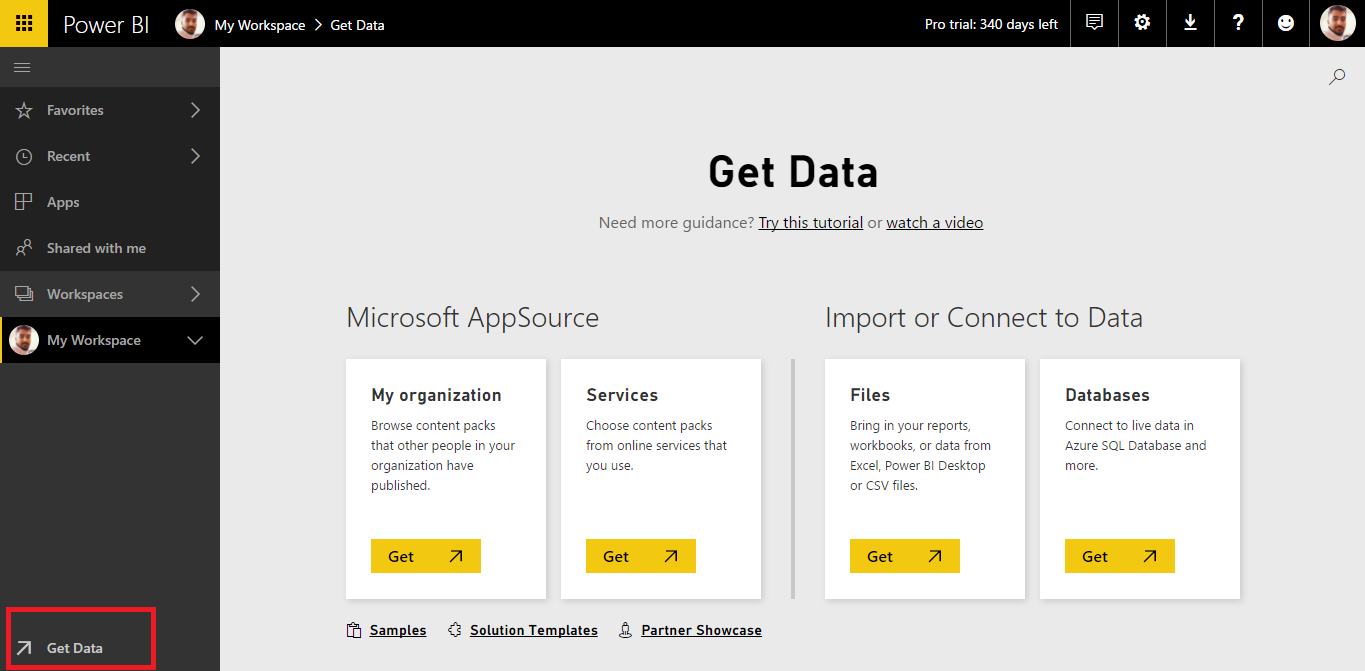
Click Get Data on the left bottom corner to select .
-
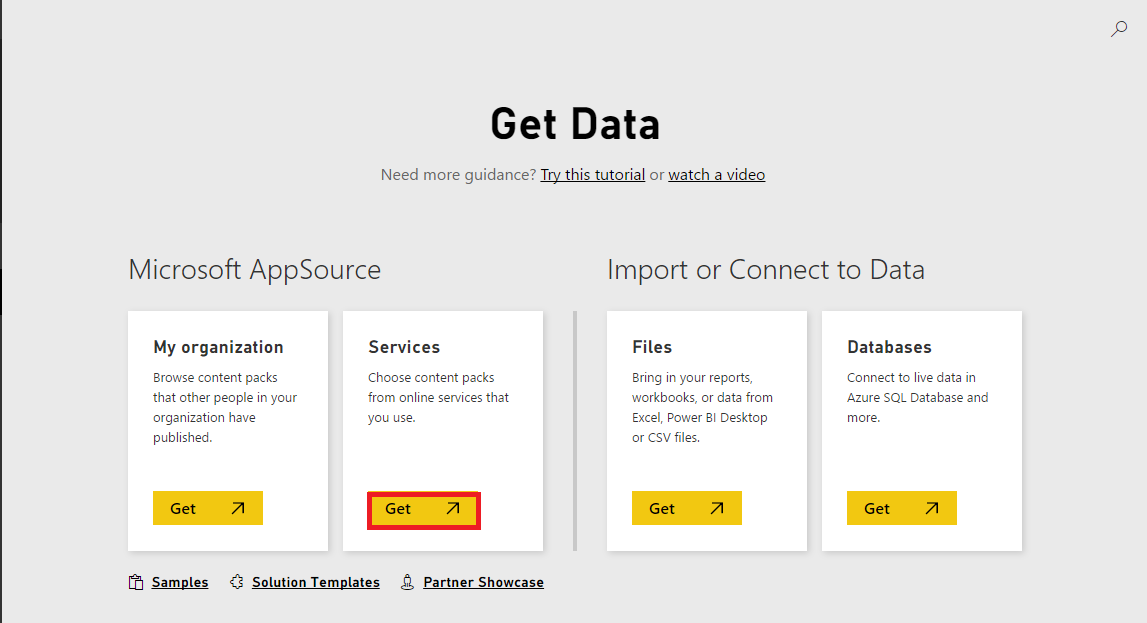
You can pull out the data either from one of the sources. Since we are integrating with VSTS, select Services and click on Get.
-
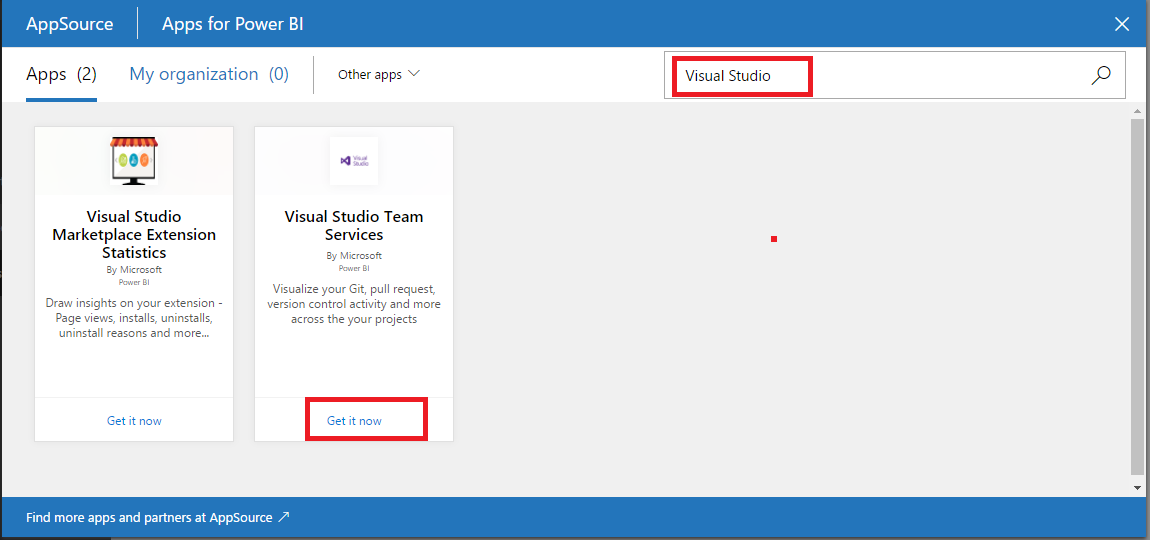
Browse the content packs, or tap in the search box and type keywords:
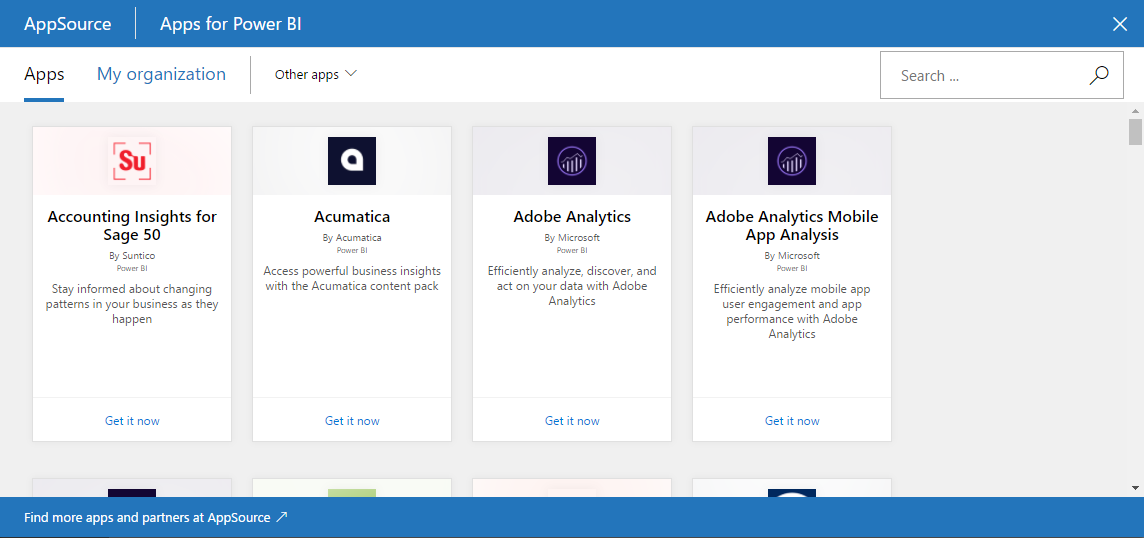
-
In the search box, type Visual Studio and click on Get it now.
-
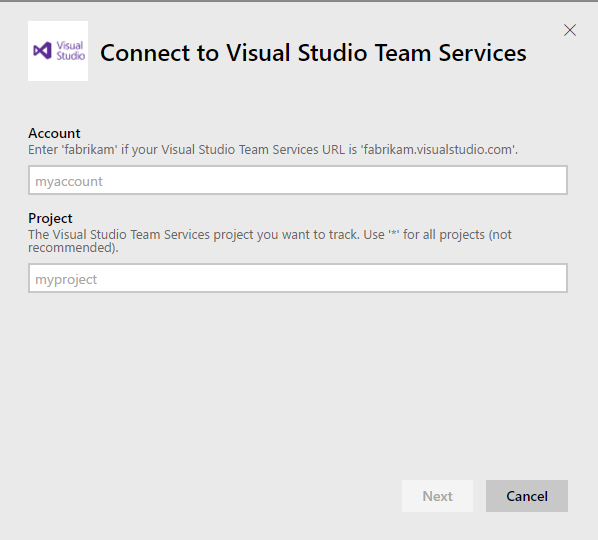
Enter YOUR ACCOUNT NAME, if your Team Services URl is YOURACCOUNTNAME.visualstudio.com. Also enter the Project name that you want to track and click on Next
-
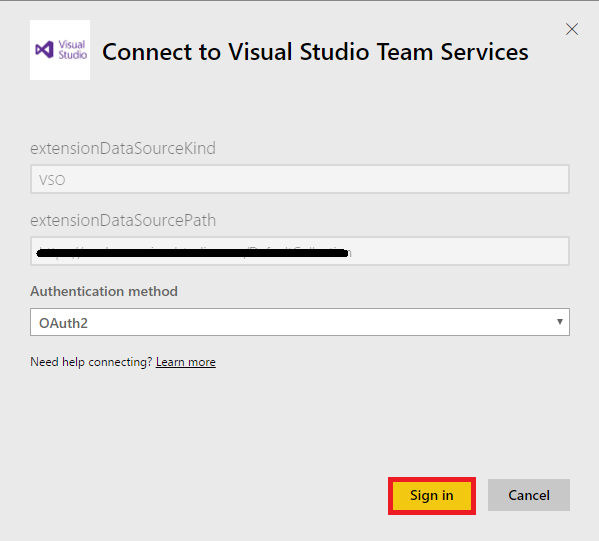
A window would appear to allow the access to your VSTS account. Click Sign in.
-
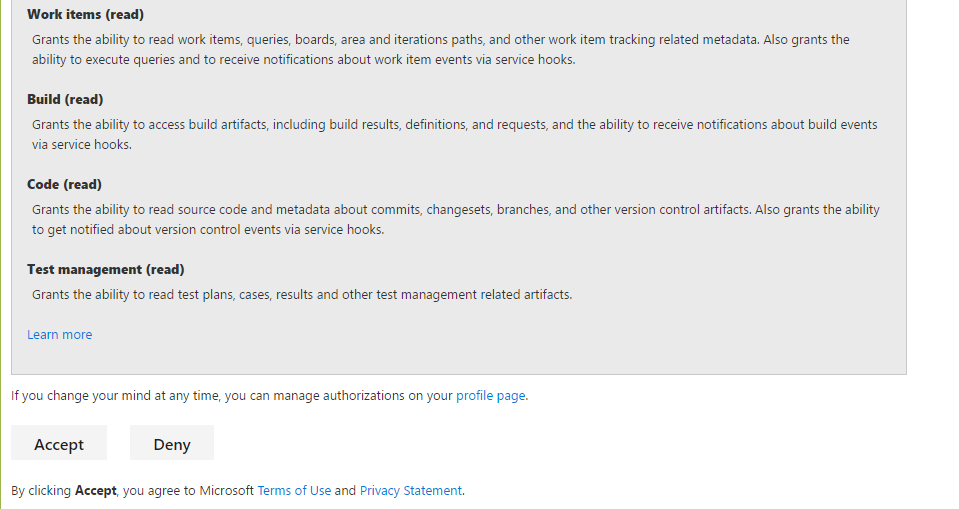
A window would pop up to allow the permission to read the data from the VSTS account. Click on Accept.
-
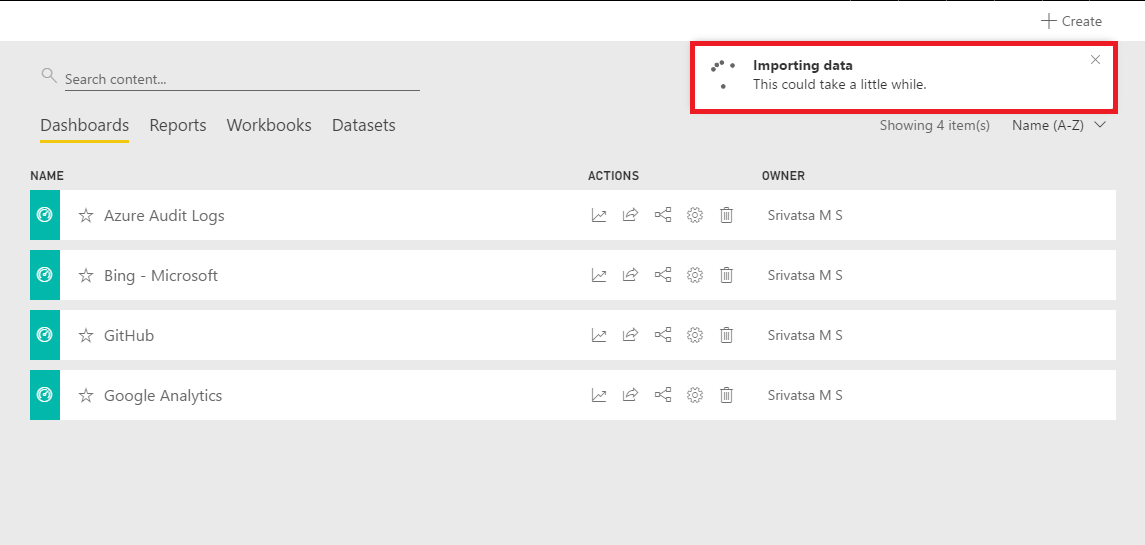
Now the data is being imported and you will see the notification on the right corner top.
-
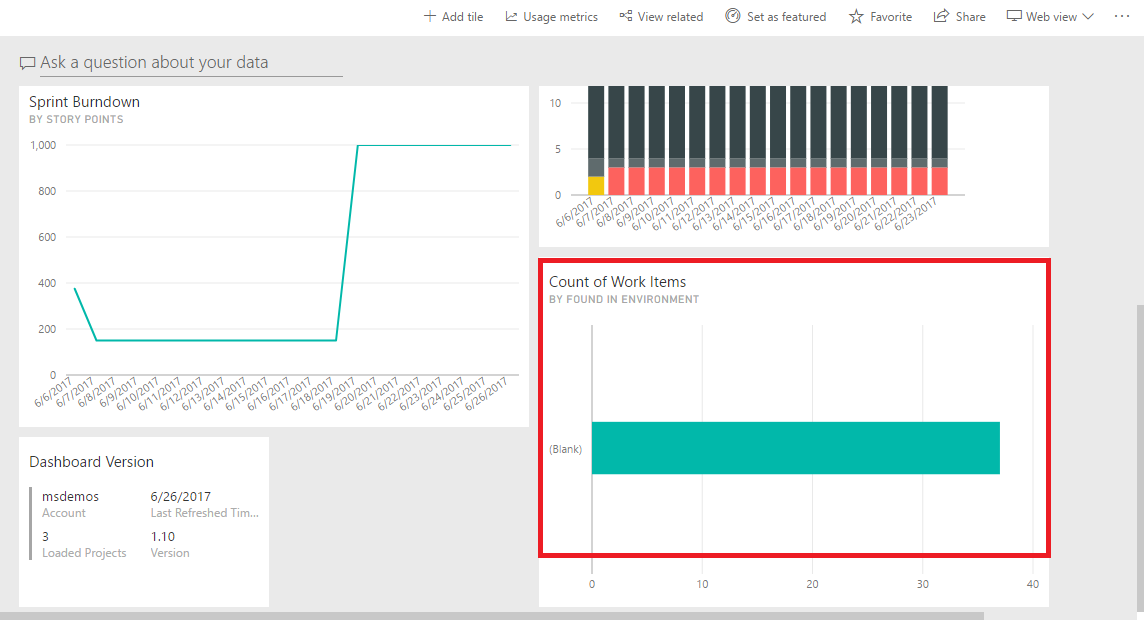
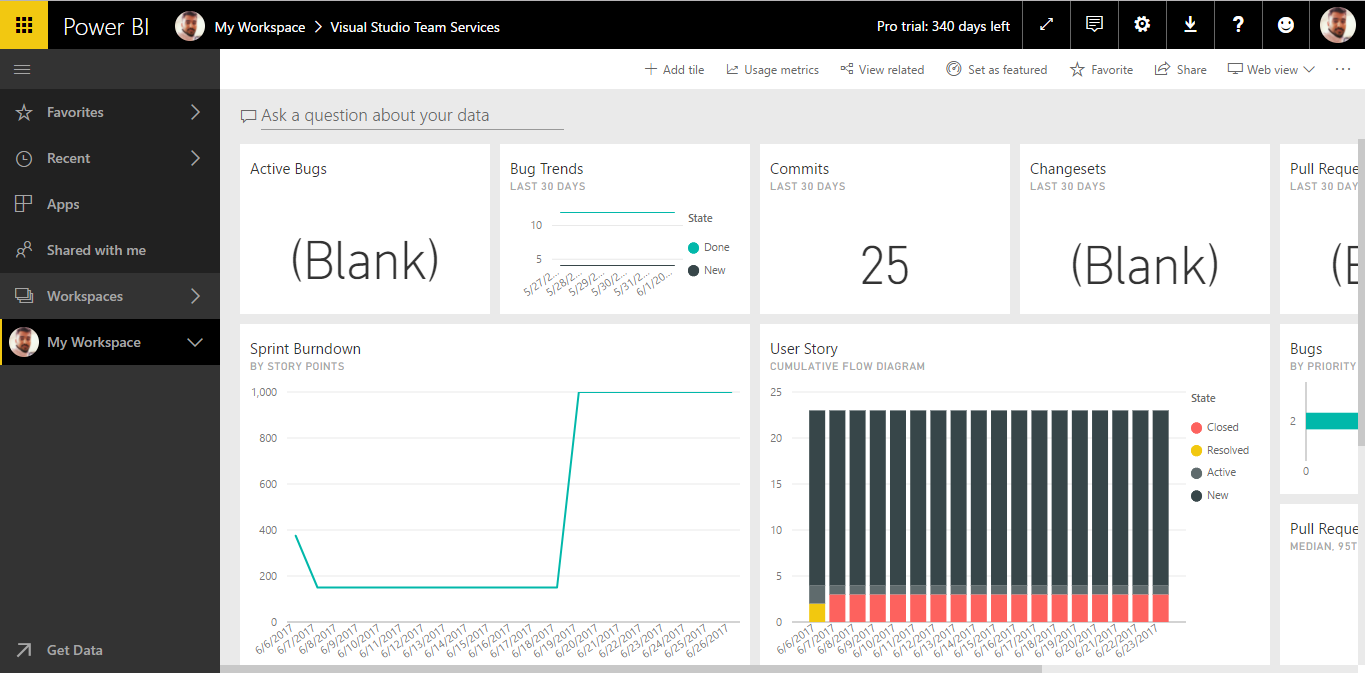
Once the data is imported, you will see the dashboard with the data.
Reports in Power BI
A Power BI report is a multi-perspective view into a dataset, with visualizations that represent different findings and insights from that dataset. A report can have a single visualization or pages full of visualizations. Depending on your job role, you may be someone who creates reports and/or you may be someone who consumes or uses reports.
-
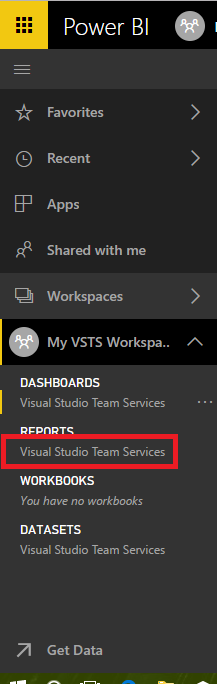
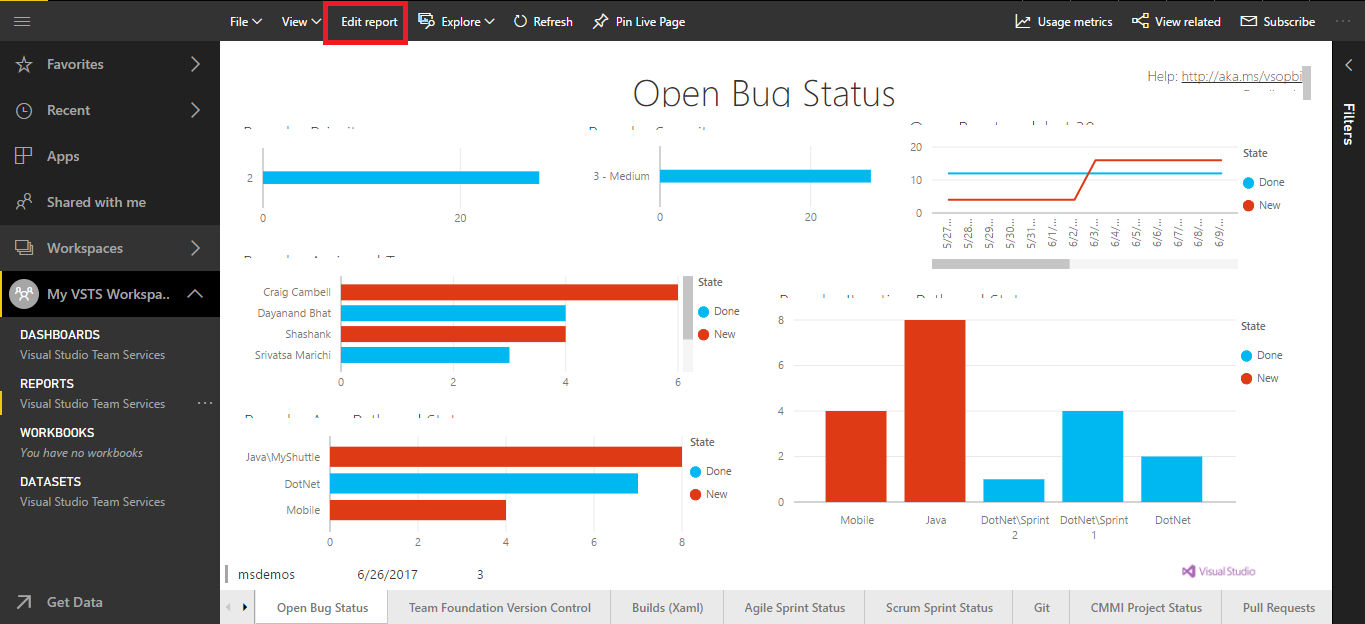
Click on Reports and select Visual Studio Team Services. By default when the data is imported, a report would have generated automatically.
-
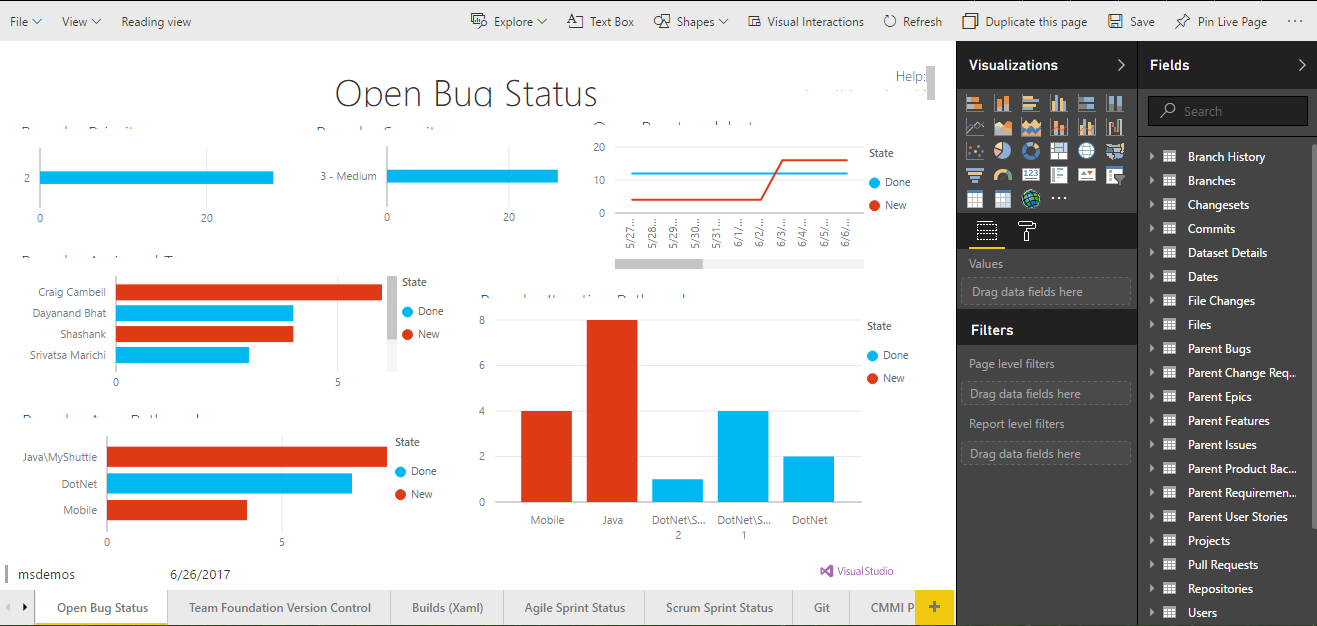
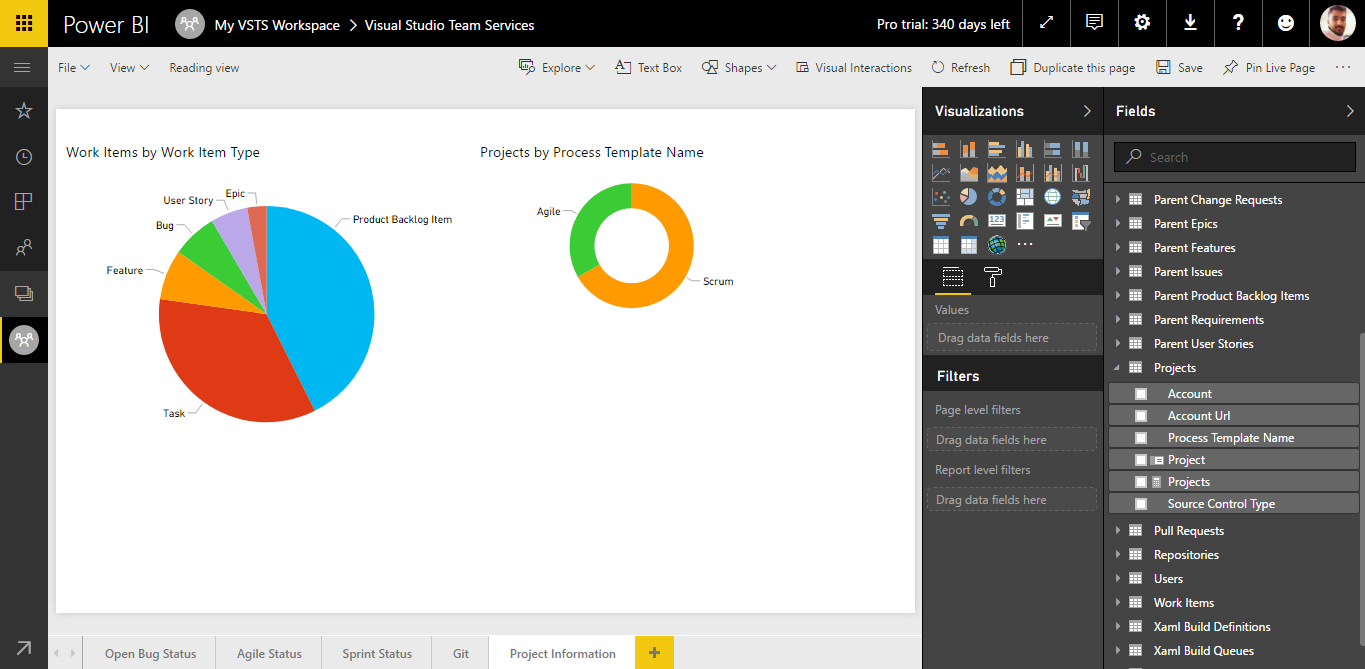
The report along with the data is shown. Modify the report to show the desired data. To do so, click on Edit report on the top.
-
Visualizations and additional data can be added from the filter sets and the visualizations table from the right side.
-
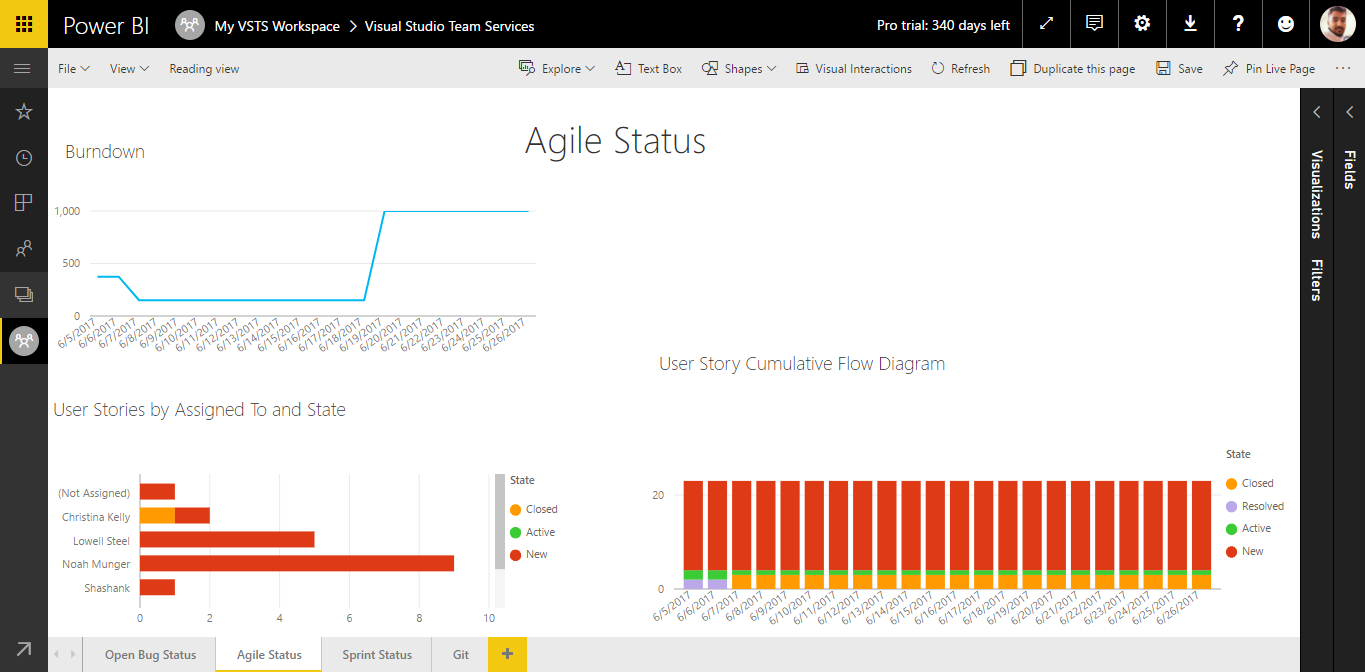
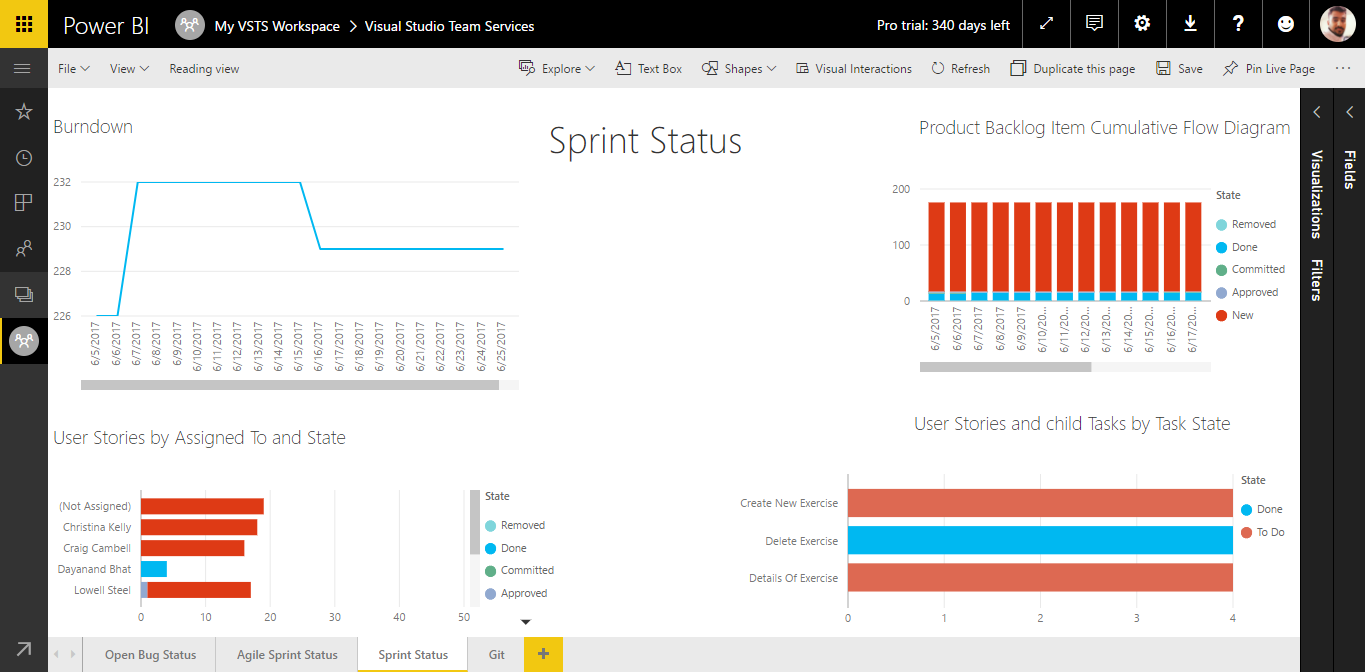
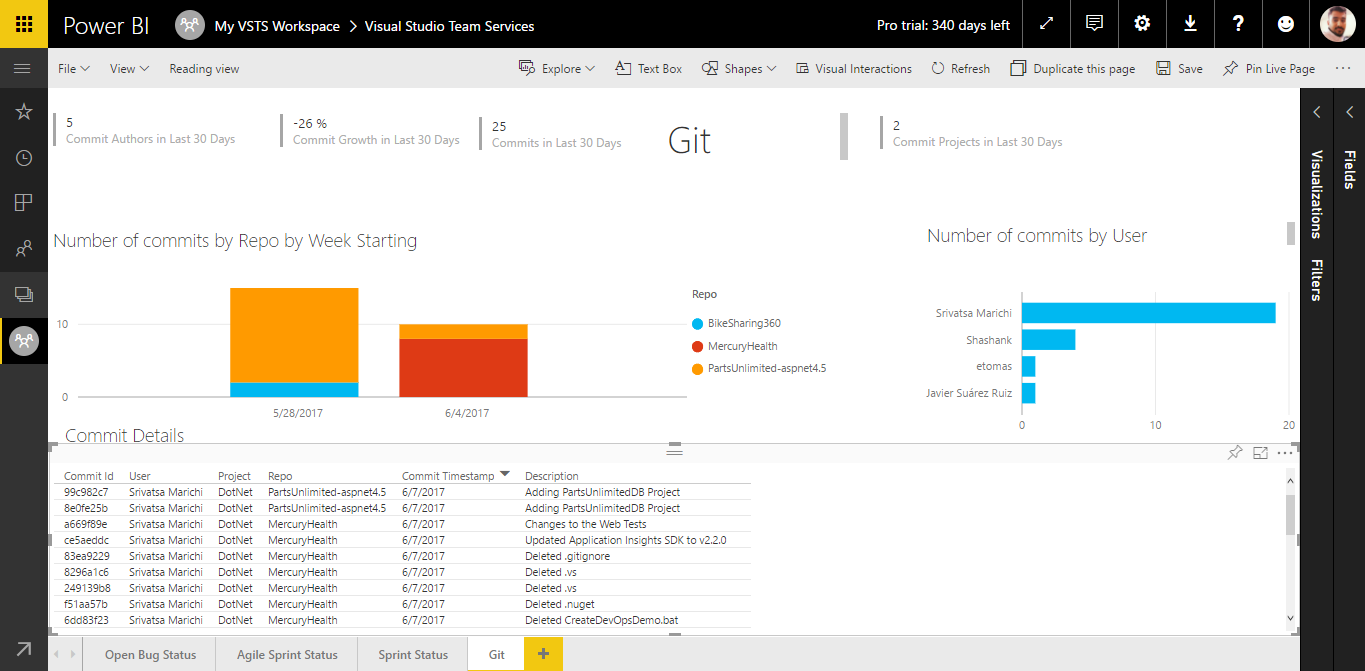
Different reports can be obtained. Agile Status report, Sprint Status report, Git report etc.
-
Add new pages to the report with the desired data. Click on + at the bottom of the report to add new and select the visualizations and data to appear in the page.
Q&A in Power BI
Sometimes the fastest way to get an answer from your data, is to ask a question using natural language. For example, what were total sales last year? Use Q&A to explore your data using intuitive, natural language capabilities and receive answers in the form of charts and graphs. Q&A is different from a search engine – Q&A only provides results about the data in Power BI.
Asking the question is just the beginning. Have fun traveling through your data refining or expanding your question, uncovering trust-worthy new information, zeroing in on details and zooming out for a broader view. You’ll be delighted by the insights and discoveries you make.
The experience is truly interactive…and fast! Powered by an in-memory storage, response is almost instantaneous.
-
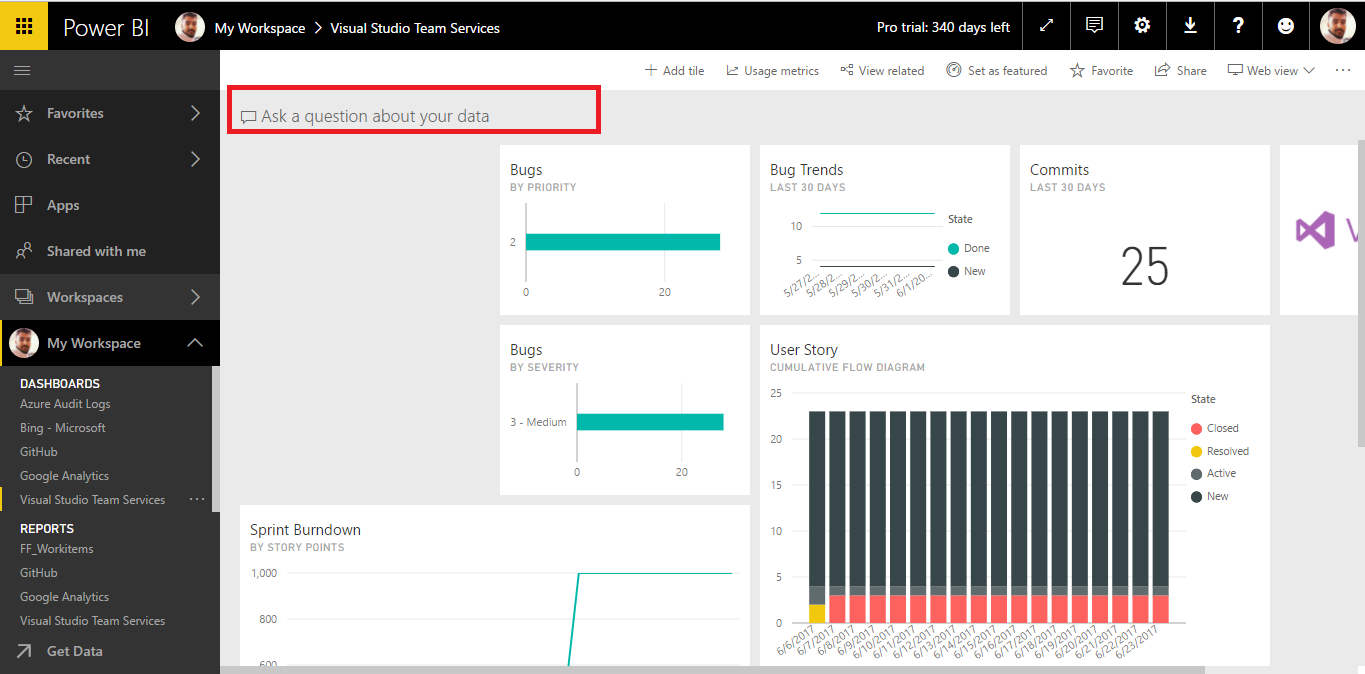
From your workspace, go to Dashboard and click on Ask a question about your data
-
Place your cursor in the question box. Even before you start typing, Q&A displays a new screen with suggestions to help you form your question.
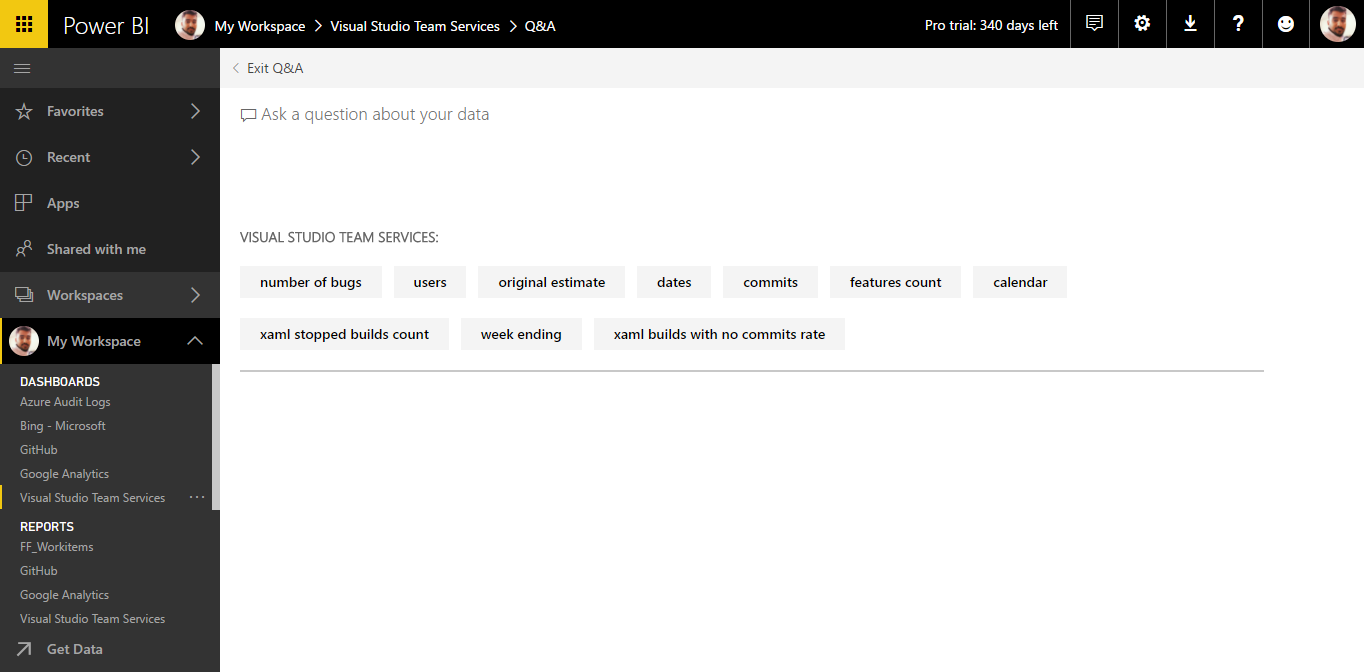
This list contains:
a. The questions used to create tiles that are already pinned to the dashboard, and
b. The name of tables in the underlying dataset(s).
You can always choose one of these questions as a starting point and continue to refine the question to find the specific answer you are looking for. Or, use a table name to help you word a new question.
-
Select from the dropdown or begin typing your own question.
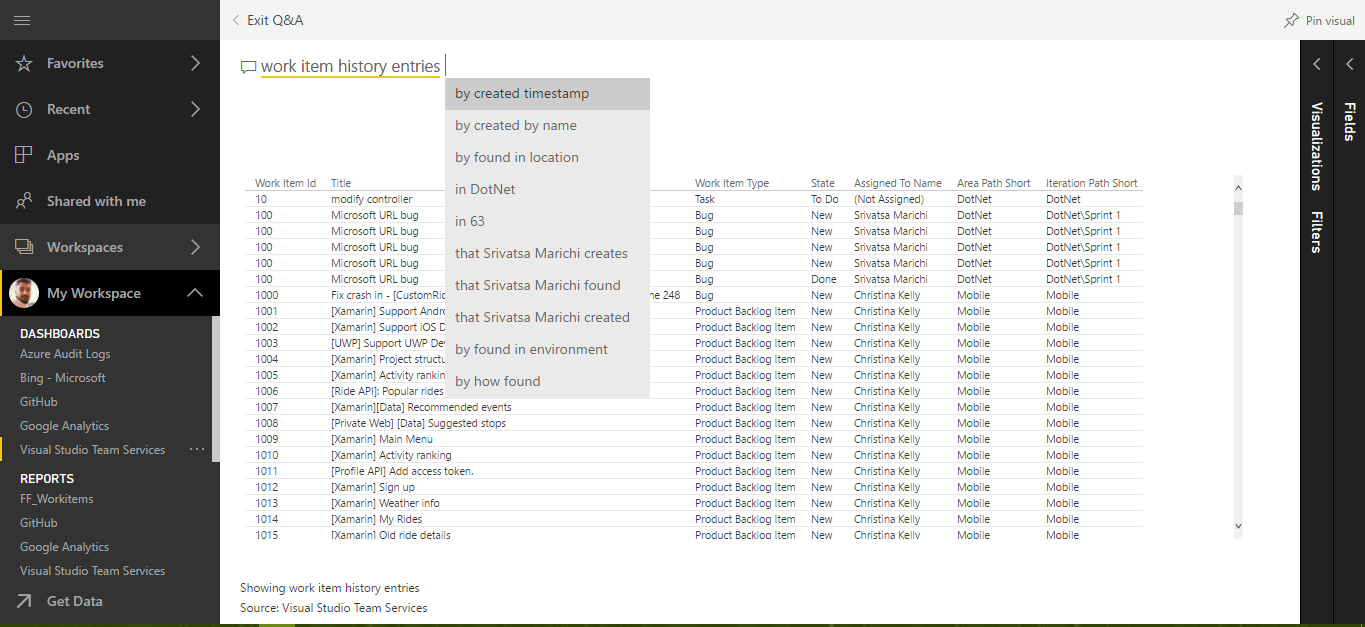
-
As you type a question, Power BI Q&A picks the best visualization to display your answer; and the visualization changes dynamically as you modify the question. Q&A also helps you formulate your question with auto-completion, by restating your question, and with other textual and visual aids.
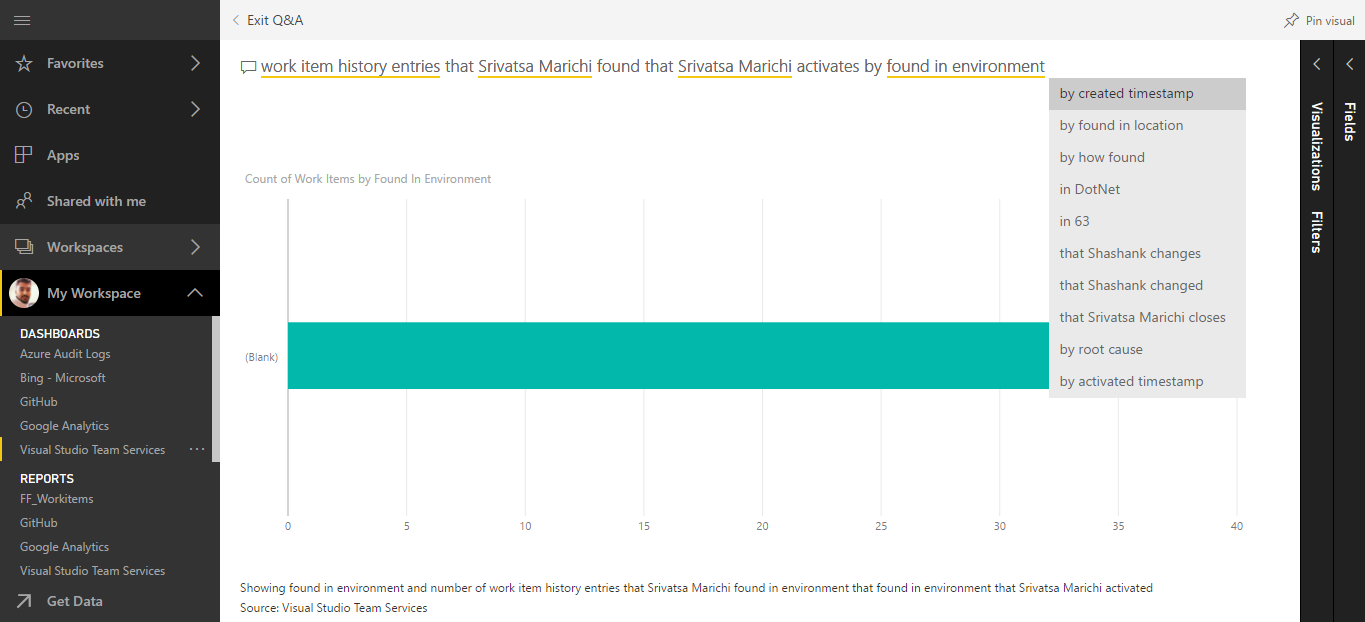
-
When you type a query, Power BI looks for an answer in any dataset that has a tile on that dashboard. If all the tiles are from datasetA, then your answer will come from datasetA. If there are tiles from datasetA and datasetB, then Q&A will search for the best answer from those 2 datasets.
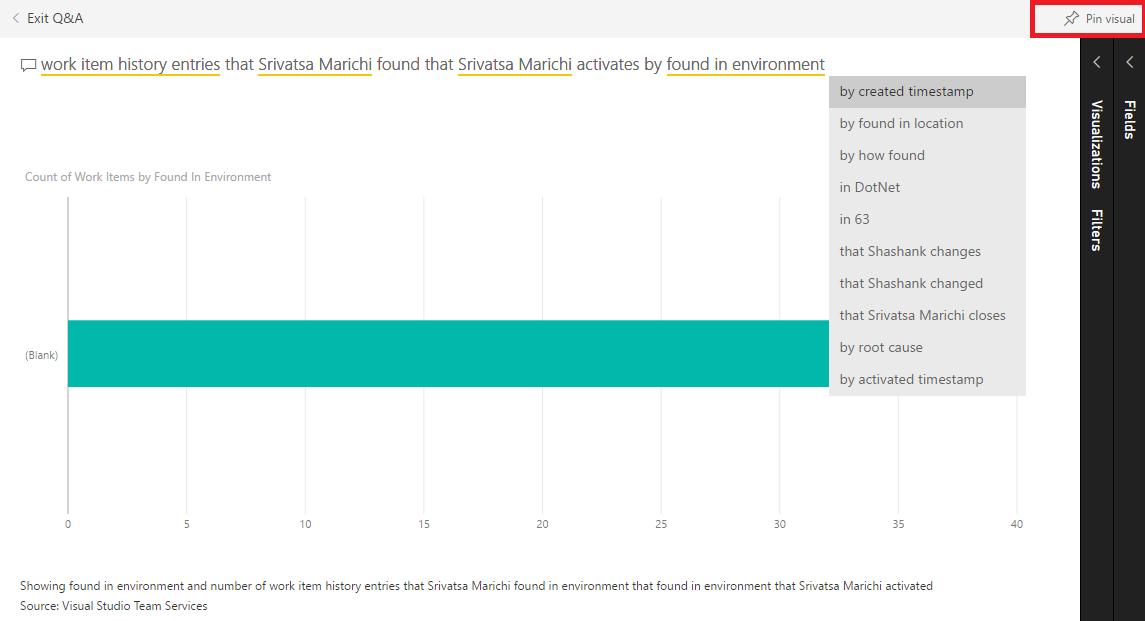
Important: If you only have one tile from datasetA and you remove it from your dashboard, Q&A will no longer have access to datasetA. -
When you’re happy with the result, pin the visualization to a dashboard by selecting the pin icon in the top right corner.
-
You can pin this to an Existing dashboard or to a New dashboard. Select Existing dashboard.
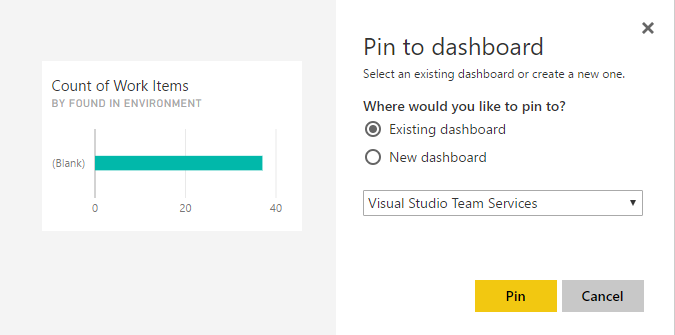
-
Go back to dashboard, you should see the pinned item now.